This is a concept-set testing module that will compute frequency distributions for the usage of either
source-to-concept or concept-to-source concept pairs in order to highlight mapping patterns and impacts
of concept standardization. The user will provide the domain definitions (domain_tbl) and a concept
set with the concepts of interest (concept_set). Sample versions of these inputs are included as data
in the package and are accessible with sourceconceptvocabularies::. Results can optionally be stratified
by site, age group, and/or time. This function is compatible with both the OMOP and the PCORnet CDMs
based on the user's selection.
Usage
scv_process(
  cohort,
  concept_set,
  omop_or_pcornet,
  domain_tbl = sourceconceptvocabularies::scv_domain_file,
  code_type,
  code_domain,
  jaccard_index = FALSE,
  multi_or_single_site = "single",
  anomaly_or_exploratory = "exploratory",
  p_value = 0.9,
  age_groups = NULL,
  time = FALSE,
  time_span = c("2012-01-01", "2020-01-01"),
  time_period = "year"
)
Arguments
- cohort
tabular input || required
The cohort to be used for data quality testing. This table should contain, at minimum:
site| character | the name(s) of institutions included in your cohortperson_id/patid| integer / character | the patient identifierstart_date| date | the start of the cohort periodend_date| date | the end of the cohort period
Note that the start and end dates included in this table will be used to limit the search window for the analyses in this module.
- concept_set
tabular input or vector || required
For analyses where
time = FALSE, this input should be a table containing the standard CDM concepts OR source concepts of interest for the analysis. This input should contain at least one of following:concept_id| integer | the concept_id of interest (required for OMOP)concept_code| character | the code of interest (required for PCORnet)
For certain PCORnet applications, it should also contain
vocabulary_id| character | the vocabulary of the code, which should match what is listed in the domain table'svocabulary_field
For analyses where
time = TRUE, this input should be a vector with up to 5 standard CDM OR source concepts of interest for the analysis. This limitation is applied to reduce computational strain. We recommend running a cross-sectional analysis first to identify potential concepts of interest, then using these as input for the longitudinal analysis.- omop_or_pcornet
string || required
A string, either
omoporpcornet, indicating the CDM format of the data- domain_tbl
tabular input || required
A table that defines the domains where concepts should be identified. This input should contain:
domain| character | the name of the CDM table where the concepts can be identifiedconcept_field| character | the name of the field in the CDM table where standardcdmcodes can be identified (i.e. drug_concept_id or dx)source_concept_field| character | the name of the field in the CDM table wheresourcecodes can be identified (i.e. drug_source_concept_id or raw_dx)date_field| character | the name of the field in the CDM table that should be used for temporal filteringvocabulary_field| character | for PCORnet applications, the name of the field in the domain table with a vocabulary identifier to differentiate concepts from one another (ex: dx_type); can be set to NA for OMOP applications
To see an example of this input, see
?sourceconceptvocabularies::scv_domain_file- code_type
string || required
A string identifying the type of concept that has been provided in the
concept_set.Acceptable values are
cdm(the standard, mapped code that is included in the CDM) orsource(the "raw" concept from the source system)- code_domain
string || required
The string name of the domain where the concepts can be identified. This input should match at least one of the domains in the
domain_tbl, and it will function to filter this table down to only the relevant domain and allow the user to store multiple domains in this table for reuse in other analyses.- jaccard_index
boolean || defaults to
FALSEA boolean indicating whether a Jaccard index should be computed at the visit level to determine how often two mapped concepts cooccur in the same encounter. This computation can help identify potential instances of post-coordination for SNOMED concepts.
This is only applicable for the
Single Site, Anomaly Detection, Cross-Sectionalcheck.- multi_or_single_site
string || defaults to
singleA string, either
singleormulti, indicating whether a single-site or multi-site analysis should be executed- anomaly_or_exploratory
string | Option to conduct an exploratory or anomaly detection analysis. Exploratory analyses give a high level summary of the data to examine the fact representation within the cohort. Anomaly detection analyses are specialized to identify outliers within the cohort.
- p_value
numeric || defaults to
0.9The p value to be used as a threshold in the Multi-Site, Anomaly Detection, Cross-Sectional analysis
- age_groups
tabular input || defaults to
NULLIf you would like to stratify the results by age group, create a table or CSV file with the following columns and use it as input to this parameter:
min_age| integer | the minimum age for the group (i.e. 10)max_age| integer | the maximum age for the group (i.e. 20)group| character | a string label for the group (i.e. 10-20, Young Adult, etc.)
If you would not like to stratify by age group, leave as
NULL- time
boolean || defaults to
FALSEA boolean to indicate whether to execute a longitudinal analysis
- time_span
vector - length 2 || defaults to
c('2012-01-01', '2020-01-01')A vector indicating the lower and upper bounds of the time series for longitudinal analyses
- time_period
string || defaults to
yearA string indicating the distance between dates within the specified time_span. Defaults to
year, but other time periods such asmonthorweekare also acceptable
Value
This function will return a dataframe summarizing the mapping patterns for each concept provided by the user. For a more detailed description of output specific to each check type, see the PEDSpace metadata repository
Examples
#' Source setup file
source(system.file('setup.R', package = 'sourceconceptvocabularies'))
#' Create in-memory RSQLite database using data in extdata directory
conn <- mk_testdb_omop()
#' Establish connection to database and generate internal configurations
initialize_dq_session(session_name = 'scv_process_test',
working_directory = my_directory,
db_conn = conn,
is_json = FALSE,
file_subdirectory = my_file_folder,
cdm_schema = NA)
#> Connected to: :memory:@NA
#' Build mock study cohort
cohort <- cdm_tbl('person') %>% dplyr::distinct(person_id) %>%
dplyr::mutate(start_date = as.Date(-5000),
#RSQLite does not store date objects,
#hence the numerics
end_date = as.Date(15000),
site = ifelse(person_id %in% c(1:6), 'synth1', 'synth2'))
#' Prepare input tables
scv_domain_tbl <- dplyr::tibble(domain = 'condition_occurrence',
concept_field = 'condition_concept_id',
source_concept_field =
'condition_source_concept_id',
date_field = 'condition_start_date',
vocabulary_field = NA)
scv_concept_set <- read_codeset('dx_hypertension')
#' Execute `scv_process` function
#' This example will use the single site, exploratory, cross sectional
#' configuration
scv_process_example <- scv_process(cohort = cohort,
multi_or_single_site = 'single',
anomaly_or_exploratory = 'exploratory',
time = FALSE,
omop_or_pcornet = 'omop',
code_type = 'cdm',
code_domain = 'condition_occurrence',
domain_tbl = scv_domain_tbl,
concept_set = scv_concept_set) %>%
suppressMessages()
#> ┌ Output Function Details ──────────────────────────────────────┐
#> │ You can optionally use this dataframe in the accompanying │
#> │ `scv_output` function. Here are the parameters you will need: │
#> │ │
#> │ Always Required: process_output, code_type │
#> │ Required for Check: num_codes, num_mappings │
#> │ Optional: vocab_tbl │
#> │ │
#> │ See ?scv_output for more details. │
#> └───────────────────────────────────────────────────────────────┘
scv_process_example
#> # A tibble: 1 × 10
#> site domain concept_id source_concept_id ct denom_concept_ct
#> <chr> <chr> <int> <int> <int> <int>
#> 1 combined condition_occurr… 320128 320128 5 5
#> # ℹ 4 more variables: denom_source_ct <int>, concept_prop <dbl>,
#> # source_prop <dbl>, output_function <chr>
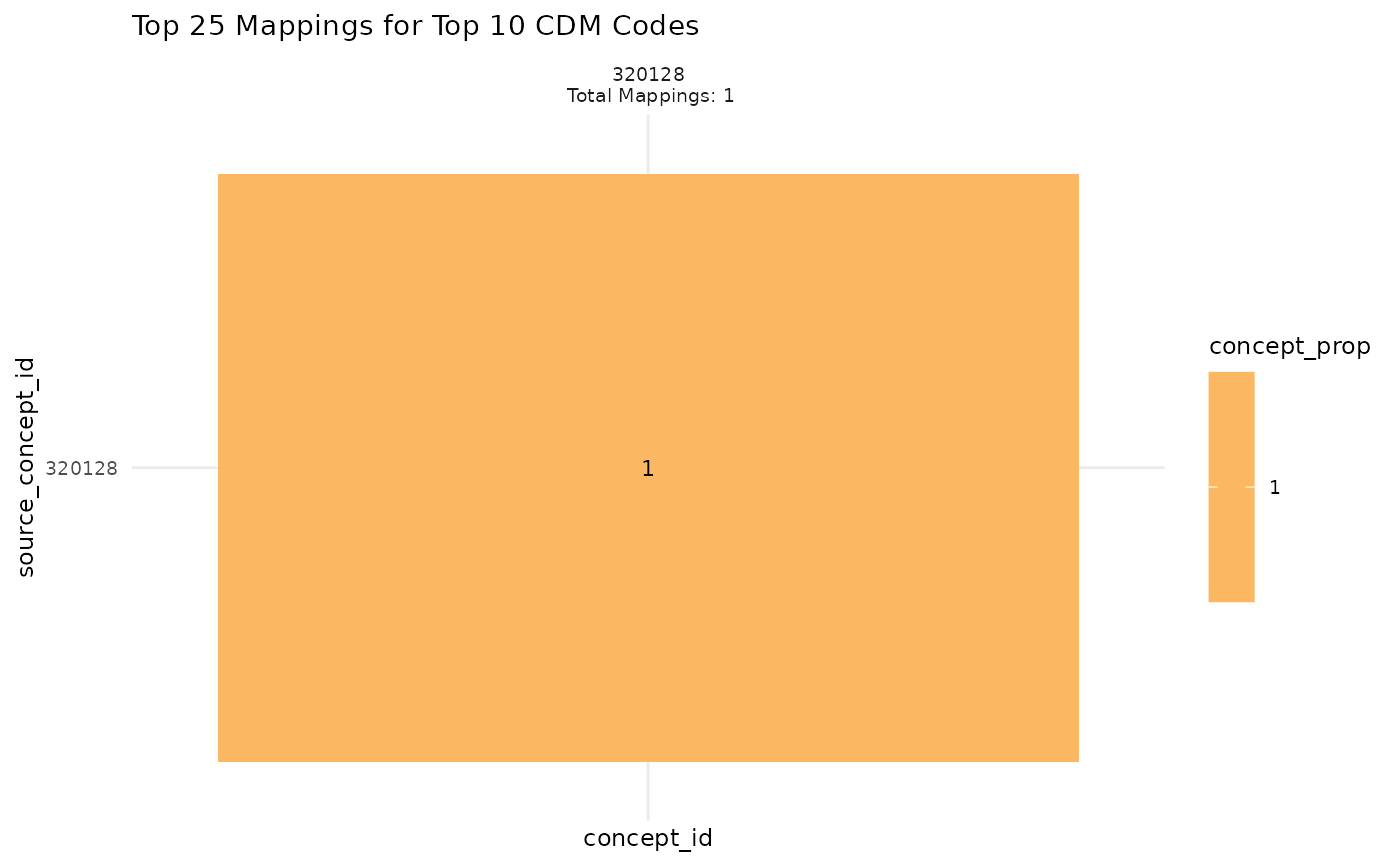
#' Execute `scv_output` function
scv_output_example <- scv_output(process_output = scv_process_example,
code_type = 'cdm',
vocab_tbl = NULL) %>%
suppressMessages()
scv_output_example[[1]]
 #' Easily convert the graph into an interactive ggiraph or plotly object with
#' `make_interactive_squba()`
make_interactive_squba(scv_output_example[[1]])
#' Easily convert the graph into an interactive ggiraph or plotly object with
#' `make_interactive_squba()`
make_interactive_squba(scv_output_example[[1]])