This function will operate with ggplot objects to use the squba
standard colors/color palettes to add color to graphs
Arguments
- palette
string || defaults to
mainThe name of the palette as it appears in
squba_palettes_standard- discrete
boolean || defaults to
TRUEA boolean indicating whether the color aesthetic is discrete or not
- reverse
boolean || defaults to
FALSEA boolean indicating whether the palette should be reversed
- ...
Any additional arguments passed to ggplot2::discrete_scale or ggplot2::scale_color_gradientn, used respectively when discrete is TRUE or FALSE
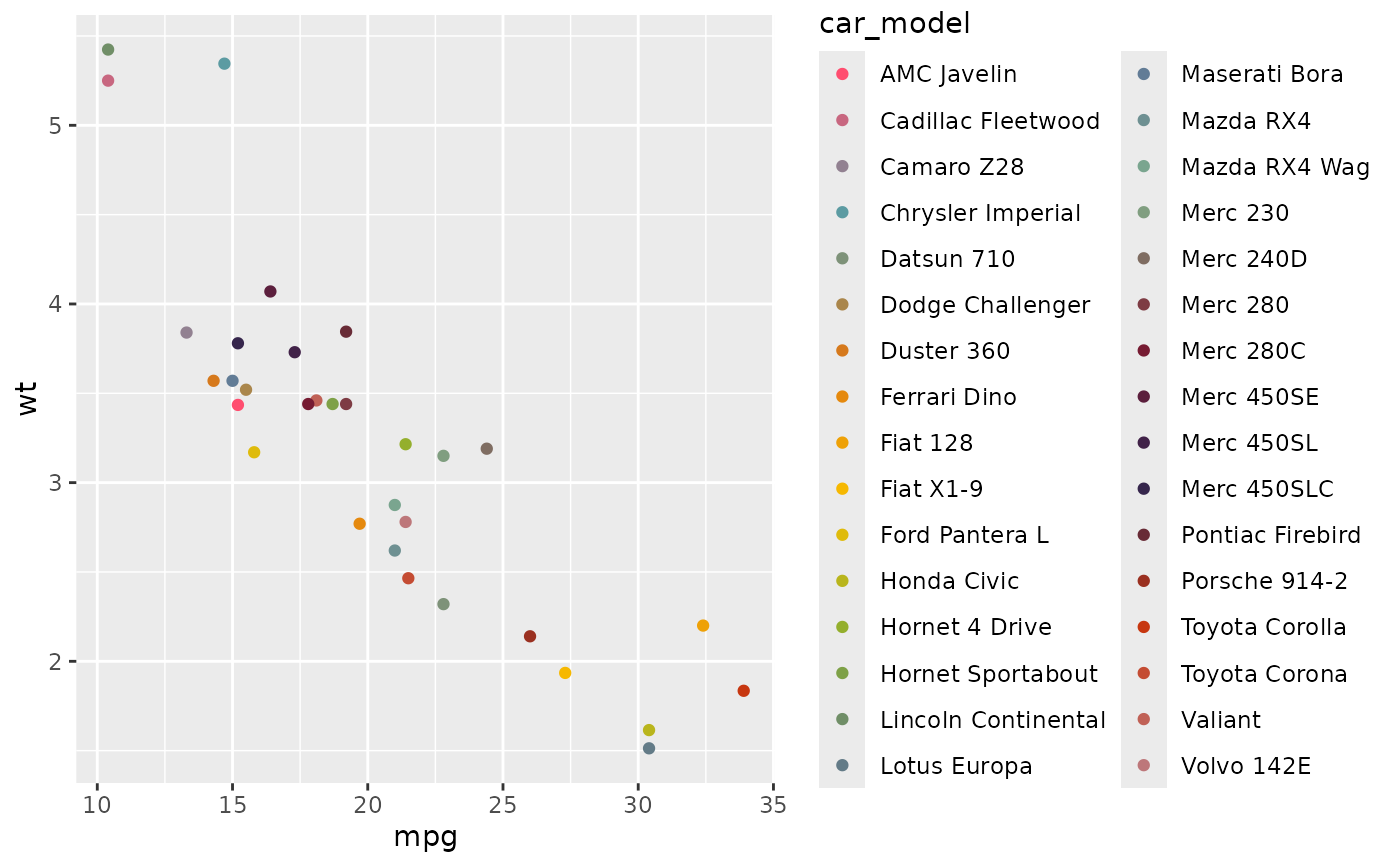
Examples
library(ggplot2)

mtcars %>%
  tibble::rownames_to_column('car_model') %>%
  ggplot(aes(x = mpg, y = wt, color = car_model)) +
  geom_point() +
  scale_color_squba()