This is a plausibility module that will assess attrition counts and how counts
change from each step to the next to help identify the most impactful and any
potentially anomalous attrition criteria. The user will provide a precomputed
attrition. A sample attrition_tbl with the expected formatting can be found
using cohortattrition::.
Usage
ca_process(
  attrition_tbl,
  multi_or_single_site = "single",
  anomaly_or_exploratory = "exploratory",
  start_step_num = 0,
  var_col = "num_pts",
  p_value = 0.9
)
Arguments
- attrition_tbl
tabular input || required
A table or CSV file with attrition information for each site included in the cohort. This table should minimally contain:
site| character | the name of the institutionstep_number| integer | a numeric identifier for the attrition stepattrition_step| character | a description of the attrition stepnum_pts| integer | the patient count for the attrition step
- multi_or_single_site
string || defaults to
singleA string, either
singleormulti, indicating whether a single-site or multi-site analysis should be executed- anomaly_or_exploratory
string || defaults to
exploratoryA string, either
anomalyorexploratory, indicating what type of results should be produced.Exploratory analyses give a high level summary of the data to examine the fact representation within the cohort. Anomaly detection analyses are specialized to identify outliers within the cohort.
- start_step_num
integer || defaults to
0The
step_numberfrom theattrition_tblthat should be considered the "start" for the analysis. This will drive comparisons of later steps to the start.- var_col
string || defaults to
num_ptsThe name of the column that should be used to conduct the analysis for the Multi-Site, Anomaly Detection, Cross-Sectional check. The options are:
num_pts: raw patient countprop_retained_start: proportion patients retained from the starting step, as indicated bystart_step_numprop_retained_prior: proportion patients retained from prior stepprop_diff_prior: proportion difference between each step and the prior step
- p_value
numeric || defaults to
0.9The p value to be used as a threshold in the Multi-Site, Anomaly Detection, Cross-Sectional analysis
Value
This function will return a dataframe with all the original attrition
information, plus columns examining the difference between each step and others.
If the Multi-Site, Anomaly Detection, Cross-Sectional check is run, this output
will also include some descriptive statistics about the chosen var_col and
an indication of which sites are outliers at each attrition step.
Examples
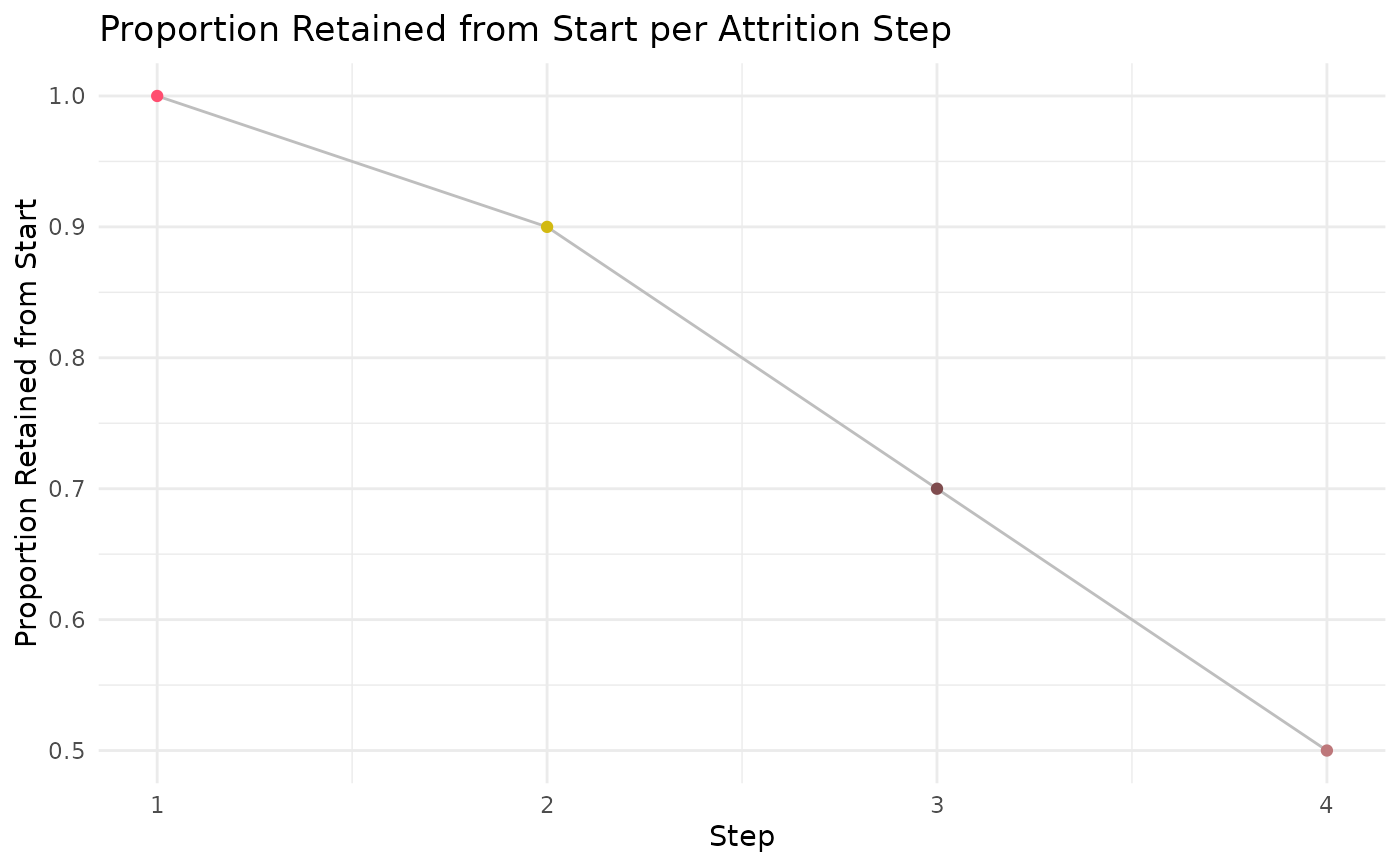
#' Build mock study attrition
sample_attrition <- dplyr::tibble('site' = c('Site A', 'Site A', 'Site A', 'Site A'),
'step_number' = c(1,2,3,4),
'attrition_step' = c('step 1', 'step 2', 'step 3', 'step 4'),
'num_pts' = c(100, 90, 70, 50))
#' Execute `ca_process` function
#' This example will use the single site, exploratory, cross sectional
#' configuration
ca_process_example <- ca_process(attrition_tbl = sample_attrition,
multi_or_single_site = 'single',
anomaly_or_exploratory = 'exploratory',
start_step_num = 1) %>%
suppressMessages()
#> ┌ Output Function Details ─────────────────────────────────────┐
#> │ You can optionally use this dataframe in the accompanying │
#> │ `ca_output` function. Here are the parameters you will need: │
#> │ │
#> │ Always Required: process_output, var_col │
#> │ Optional: log_scale │
#> │ │
#> │ See ?ca_output for more details. │
#> └──────────────────────────────────────────────────────────────┘
ca_process_example
#> # A tibble: 4 × 9
#> site step_number attrition_step num_pts prop_retained_prior ct_diff_prior
#> <chr> <dbl> <chr> <dbl> <dbl> <dbl>
#> 1 Site A 1 step 1 100 NA NA
#> 2 Site A 2 step 2 90 0.9 10
#> 3 Site A 3 step 3 70 0.778 20
#> 4 Site A 4 step 4 50 0.714 20
#> # ℹ 3 more variables: prop_diff_prior <dbl>, prop_retained_start <dbl>,
#> # output_function <chr>
#' Execute `ca_output` function
ca_output_example <- ca_output(process_output = ca_process_example,
log_scale = FALSE,
var_col = 'prop_retained_start')
ca_output_example[[1]]
 ca_output_example[[2]]
Attrition Step Reference
Step Number
Description
#' Easily convert the graph into an interactive ggiraph or plotly object with
#' `make_interactive_squba()`
make_interactive_squba(ca_output_example[[1]])